Ziguinchor: When young people map their own neighbourhood
In Ziguinchor, in the neighbourhoods of Tilène, Kandialang Ouest, Néma 2, Kande Alassane, Cobitène, and Lyndiane 2, young people decided to stop waiting for others to change their living environment for them.
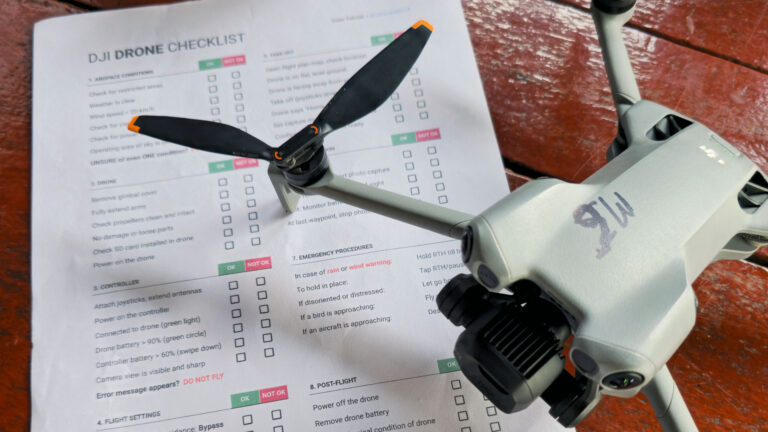
From October 2025 to June 2026, through the project “Transforming Vulnerable Neighbourhoods through Data, Youth Entrepreneurship, and Social Innovation,” led by urbaSEN and the Fédération Sénégalaise des Habitants (FSH), they learned to film, map, collect, manage and share data. And after the weeks of training came the most demanding part: going into the field.
The data was collected door-to-door, using the Know Your City methodology, with KoboToolbox and ODK in hand. But behind this somewhat dry word “data,” there is a precise and concrete portrait of six neighbourhoods which official maps most often left in the dark.
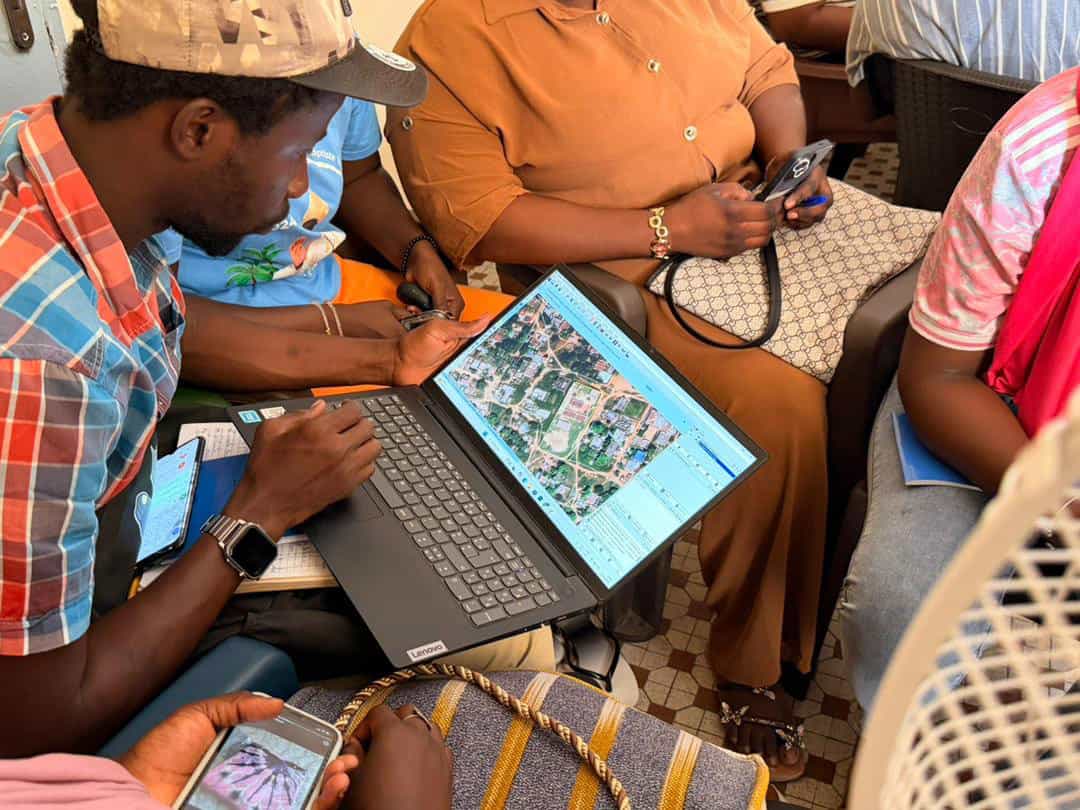
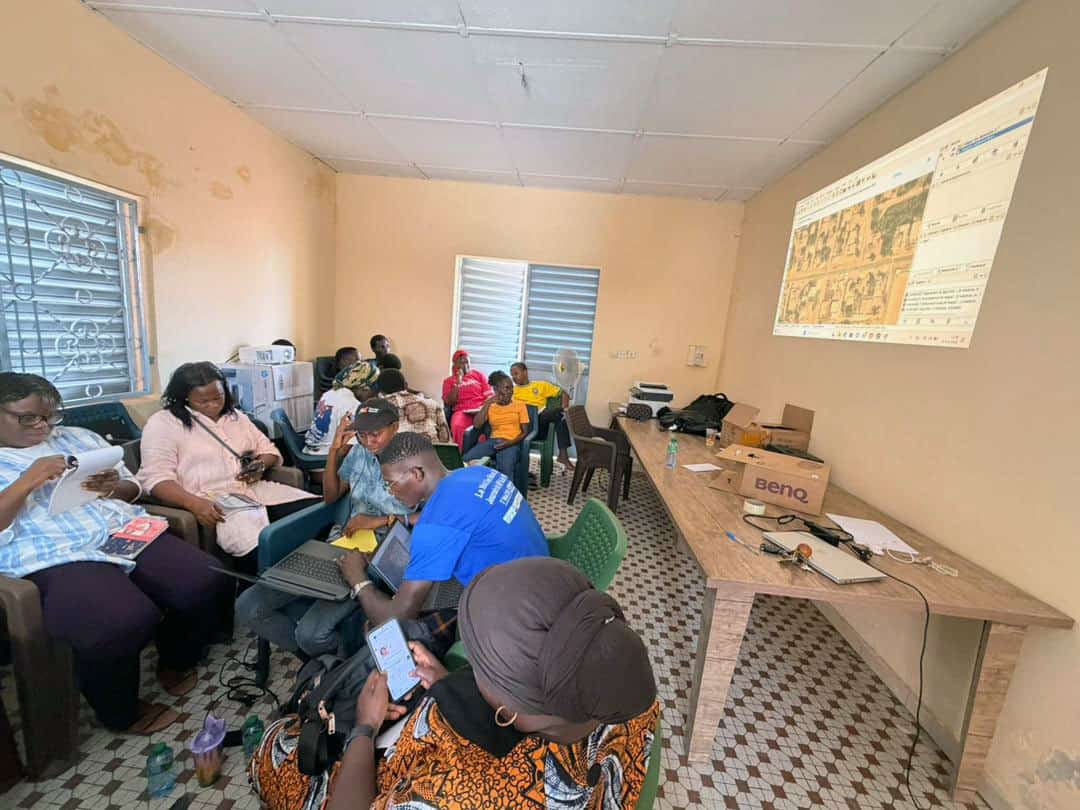
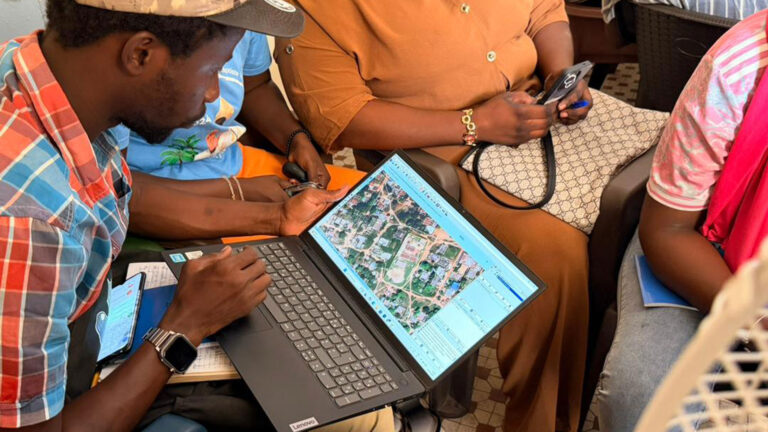
Training in Collaborative OpenStreetMap (OSM) Mapping
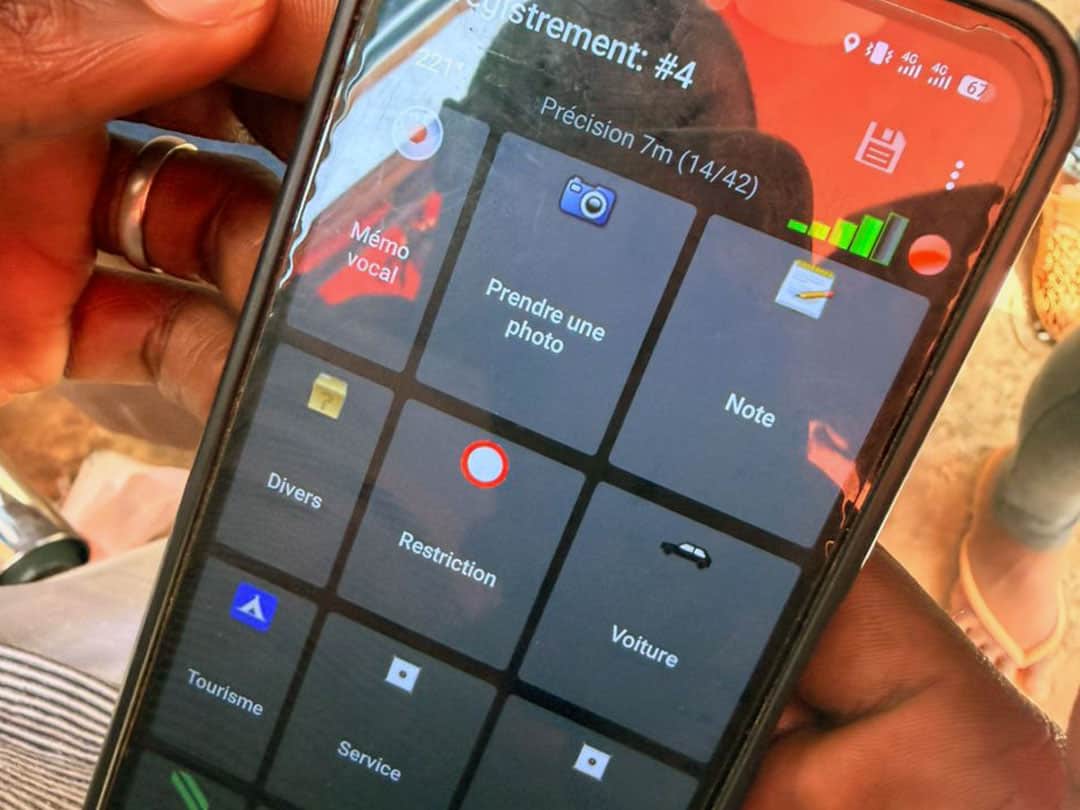
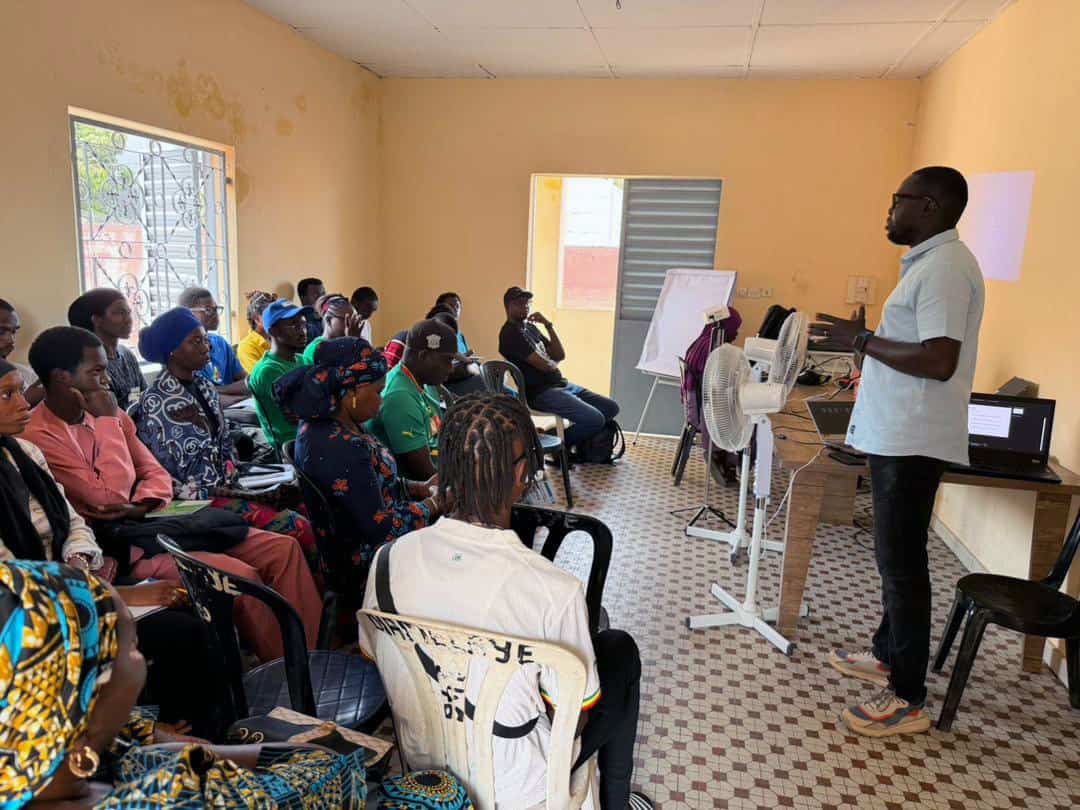
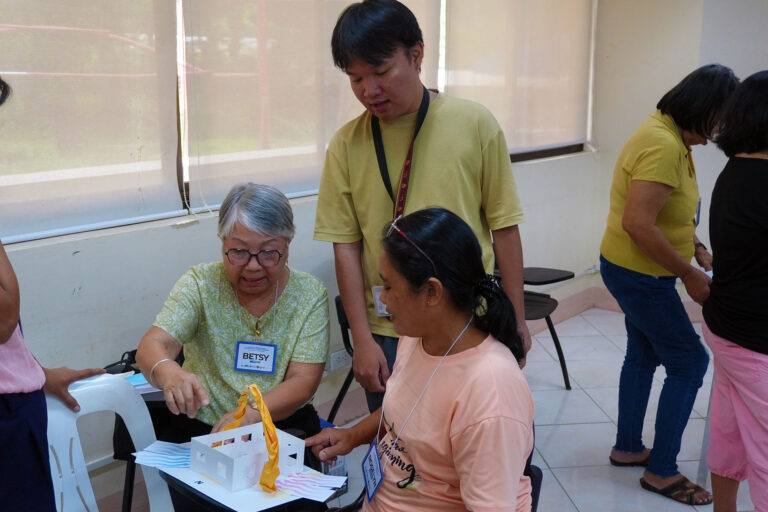
Training in Data Collection Tools and Survey Methodologies
Training in Data Collection Tools and Survey Methodologies
From October 2025 to June 2026, through the project “Transforming Vulnerable Neighbourhoods through Data, Youth Entrepreneurship, and Social Innovation,” led by urbaSEN and the Fédération Sénégalaise des Habitants (FSH), they learned to film, map, collect, manage and share data. And after the weeks of training came the most demanding part: going into the field.
The data was collected door-to-door, using the Know Your City methodology, with KoboToolbox and ODK in hand. But behind this somewhat dry word “data,” there is a precise and concrete portrait of six neighbourhoods which official maps most often left in the dark.
The young people began by cataloguing the infrastructure that structures daily life: schools, health centres, places of worship, markets and water points. For each facility, they noted its exact GPS location, the condition of the building, the level of use, and, most importantly, what was lacking. A map showing where there is no school or health centre is sometimes more useful than a map showing where they exist.
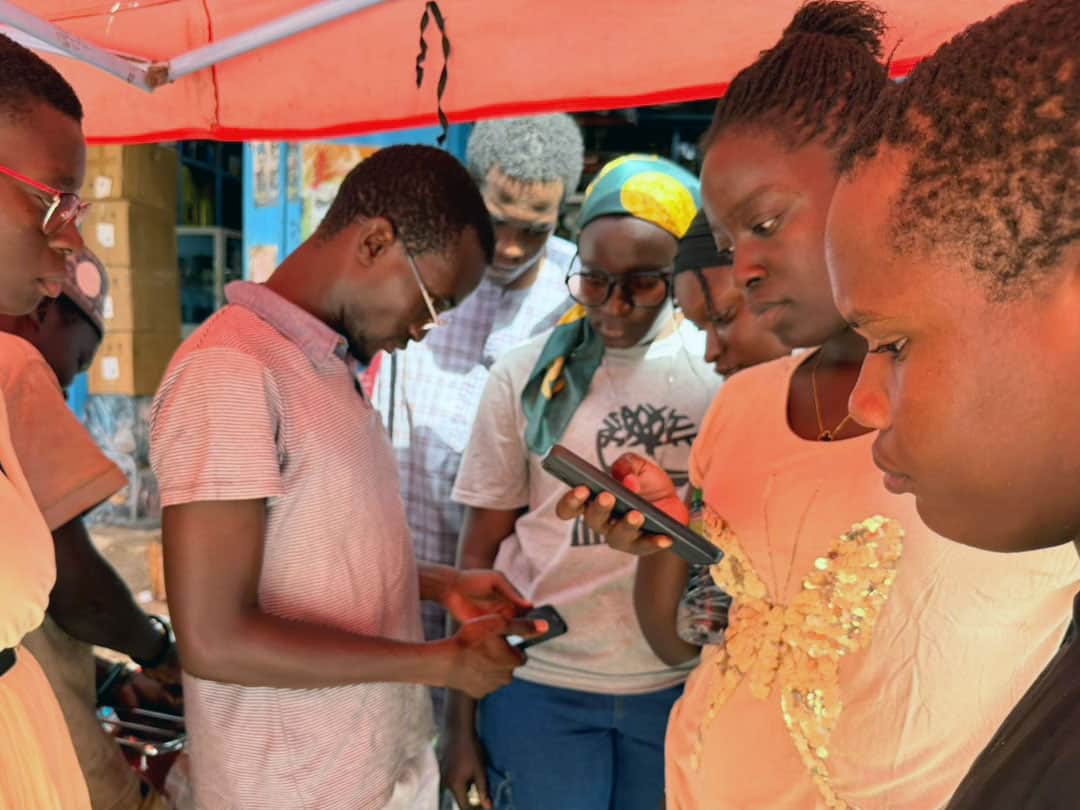
Waste data collection and mapping
Waste data collection and mapping
They then turned their attention to the roads. Which streets are paved, which become impassable with the first rain, and which don’t even have names? In neighbourhoods where an ambulance or fire truck can get stuck due to lack of access, mapping the roads is far from an abstract exercise: it’s about documenting who can be rescued and who cannot.
The infrastructure component completed this picture: street lighting, drinking fountains, community furniture and shared spaces. Here again, the survey helped distinguish what exists, what works and what has fallen into disrepair: three realities that are too often confused.
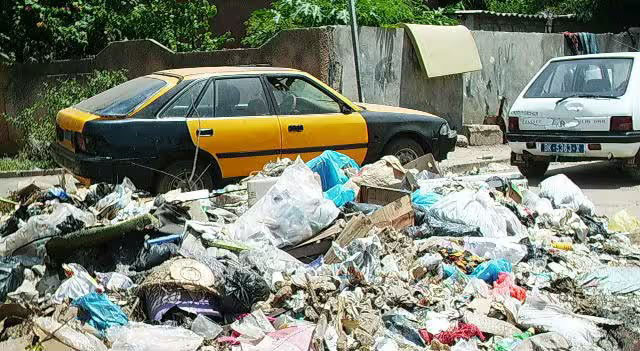
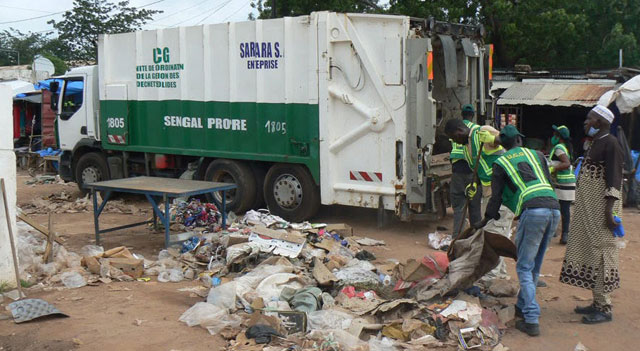
The issue of waste was a major focus, because it’s immediately apparent when walking through the neighbourhood. The young people located illegal dumpsites, followed informal collection routes and identified areas where garbage accumulates due to a lack of collection points. This data transforms a nuisance into a problem that can be solved and evidence to negotiate with the municipality for improved technical services.
Finally, sanitation: wastewater disposal, stormwater management, the condition of pipes and flood zones. This is undoubtedly the most sensitive issue, because it intersects with public health, housing and climate risk. By documenting where water stagnates and drains poorly, the young people have created a concrete basis for considering how to adapt their neighbourhoods.
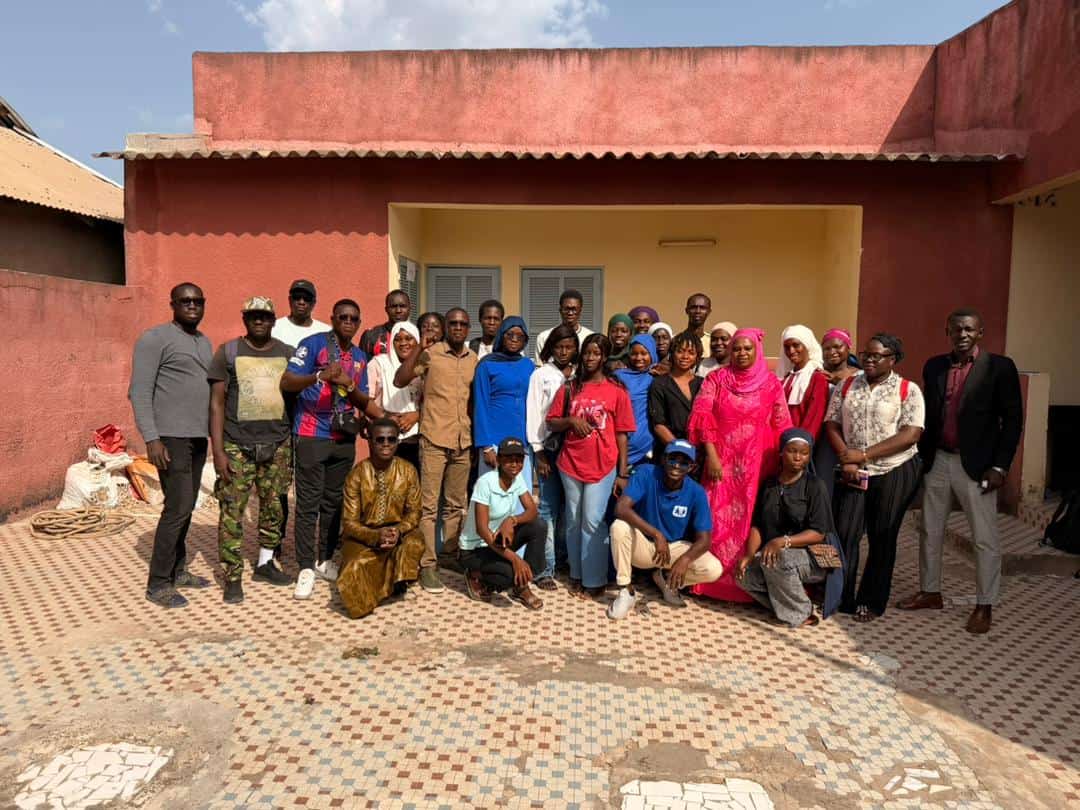
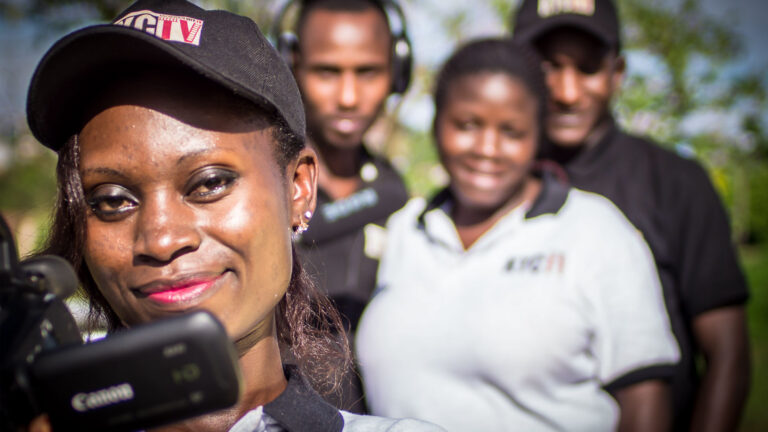
Training in Visual and Audiovisual Production
Training in Data Collection Tools, Survey Methodologies and Focus Group Facilitation
Training in Visual and Audiovisual Production
With participatory mapping on OpenStreetMap, all this information has come out of the invisible: areas previously absent from maps now exist, with their streets, their facilities and their deficiencies.
To conclude this first year, a peer-to-peer exchange hosted by Centre of Dialogue on Human Settlement and Poverty Alleviation (CODOHSAPA) and the Federation of the Urban and Rural Poor (FEDURP) was held in Bo, Sierra Leone, from June 15 to 19, 2026, bringing together SDI youth from Ghana, Sierra Leone and Senegal for mutual learning.
Filming, mapping, collecting, managing, sharing: at each stage, young people hold the tools. In Ziguinchor, data is no longer the domain of outside experts. It has become a lever for taking action, challenging local authorities, and sustainably transforming neighbourhoods based on what their own residents have seen, measured, and told.
Ziguinchor : quand les jeunes cartographient leur propre quartier
À Ziguinchor, dans les quartiers de Tilène, Kandialang Ouest, Néma 2, Kande Alassane, Cobitène et Lyndiane 2, des jeunes ont décidé de ne plus attendre que d’autres décrivent leur cadre de vie à leur place. D’octobre 2025 à juin 2026, à travers le projet « Transformation des quartiers vulnérables par les données, l’entrepreneuriat des jeunes et l’innovation sociale », porté par urbaSEN et la Fédération Sénégalaise des Habitants (FSH), ils ont appris à filmer, à cartographier, à collecter, à gérer et à partager. Et après les semaines de formation est venu le moment le plus exigeant : descendre sur le terrain.
La collecte s’est faite porte à porte, selon la méthodologie Know Your City, avec KoboToolbox et ODK dans les mains. Mais derrière ce mot un peu sec de « données », il y a en réalité le portrait précis et concret de six quartiers que les cartes officielles laissaient le plus souvent dans le flou.
Les jeunes ont d’abord recensé les infrastructures qui structurent la vie quotidienne : écoles, postes de santé, lieux de culte, marchés, points d’eau. Pour chaque équipement, ils ont noté la position exacte au GPS, l’état du bâti, le niveau de fréquentation, et surtout ce qui manquait. Une carte qui montre où il n’y a pas d’école ou pas de poste de santé est parfois plus utile qu’une carte qui montre où ils existent.
Formation à la cartographie collaborative OpenStreetMap (OSM)
Formation aux outils de collecte de données et aux méthodologies d'enquête
Formation aux outils de collecte de données et aux méthodologies d'enquête
Ils se sont ensuite penchés sur la voirie. Quelles rues sont bitumées, lesquelles deviennent impraticables à la première pluie, lesquelles ne portent même pas de nom ? Dans des quartiers où une ambulance ou un camion de pompiers peut rester bloqué faute d’accès, cartographier la voirie n’a rien d’un exercice abstrait : c’est documenter qui peut être secouru et qui ne le peut pas.
Le volet équipements a complété ce tableau : éclairage public, bornes-fontaines, mobilier collectif, espaces communautaires. Là encore, l’enquête a permis de distinguer ce qui existe, ce qui fonctionne, et ce qui est tombé à l’abandon : trois réalités que l’on confond trop souvent.
La question des déchets a occupé une place importante, parce qu’elle saute aux yeux dès qu’on marche dans le quartier. Les jeunes ont localisé les dépôts sauvages, suivi les circuits informels de ramassage, repéré les zones où les ordures s’accumulent faute de point de collecte. Cette donnée transforme une nuisance subie en problème lisible, donc négociable avec la commune et les services techniques.
Collecte et cartographie des données sur les déchets
Collecte et cartographie des données sur les déchets
Enfin, l’assainissement : évacuation des eaux usées, gestion des eaux de pluie, état des canalisations, zones inondables. C’est sans doute le sujet le plus sensible, parce qu’il croise la santé publique, l’habitat et le risque climatique. En documentant où l’eau stagne et où elle s’écoule mal, les jeunes ont produit une base concrète pour penser l’adaptation de leurs quartiers.
Avec la cartographie participative sur OpenStreetMap, toutes ces informations sont sorties de l’invisible : des zones jusqu’ici absentes des cartes existent désormais, avec leurs rues, leurs équipements et leurs manques.
Pour clôturer cette première année, un échange entre pairs organisé par le Centre pour le dialogue sur l’habitat humain et la lutte contre la pauvreté (CODOHSAPA) et la Fédération des pauvres des zones urbaines et rurales (FEDURP) s’est tenu à Bo, en Sierra Leone, du 15 au 19 juin 2026, réunissant des jeunes du programme SDI venus du Ghana, de la Sierra Leone et du Sénégal dans un esprit d’apprentissage mutuel.
Formation en production visuelle et audiovisuelle
Formation aux outils de collecte de données, aux méthodologies d'enquête et à l'animation de groupes de discussion
Formation en production visuelle et audiovisuelle
Filmer, cartographier, collecter, gérer, partager : à chaque étape, ce sont les jeunes qui tiennent les outils. À Ziguinchor, la donnée n’est plus une affaire d’experts venus de l’extérieur. Elle devient un levier pour entreprendre, interpeller les autorités locales et transformer durablement les quartiers à partir de ce que leurs propres habitants ont vu, mesuré et raconté.